
 Author: Bianca Williams
More Strategic has more in common with Strategic Grants than a shared title – both organisations help secure funding for not for profit organisations through establishing robust and sustainable fundraising practices to achieve their financial targets, and deliver on their organisations’ mission – strategically!
Martin Paul, a Director at More Strategic, has worked with nonprofits for more than 25 years providing consultancy in adapting best practice commercial and marketing practices to the sector. Specialising in a suite of fundraising and marketing skills, Martin features as our guest blogger to provide insight into how your organisation can effectively manage its Trusts and Foundations’ program by ‘Benchmarking your organisations grants performance’
Fundraising – how is your organisation performing?
Every year, we (the team at More Strategic) collect detailed management accounts from 25-30 charities and undertake deep analysis into the profitability, share of market and growth trends for every type of fundraising. It is not enough to just compare your performance to last year or to your budget – you need to know how you are doing compared to other organisations if you are to establish whether you are under or over performing.
Reliance and Ratio data – evaluating grants performance
One of our favourite charts that looks at the data set for 2018 is the reliance and ratio chart below. Our data set for 2018 includes 26 charities with a combined income of $425m and the chart below shows the proportion of income from each type of fundraising (vertical) and the associated cost income ratio (horizontal). Trusts and Foundations make up 5% of all revenue and have an overall cost income ratio of just 8%.
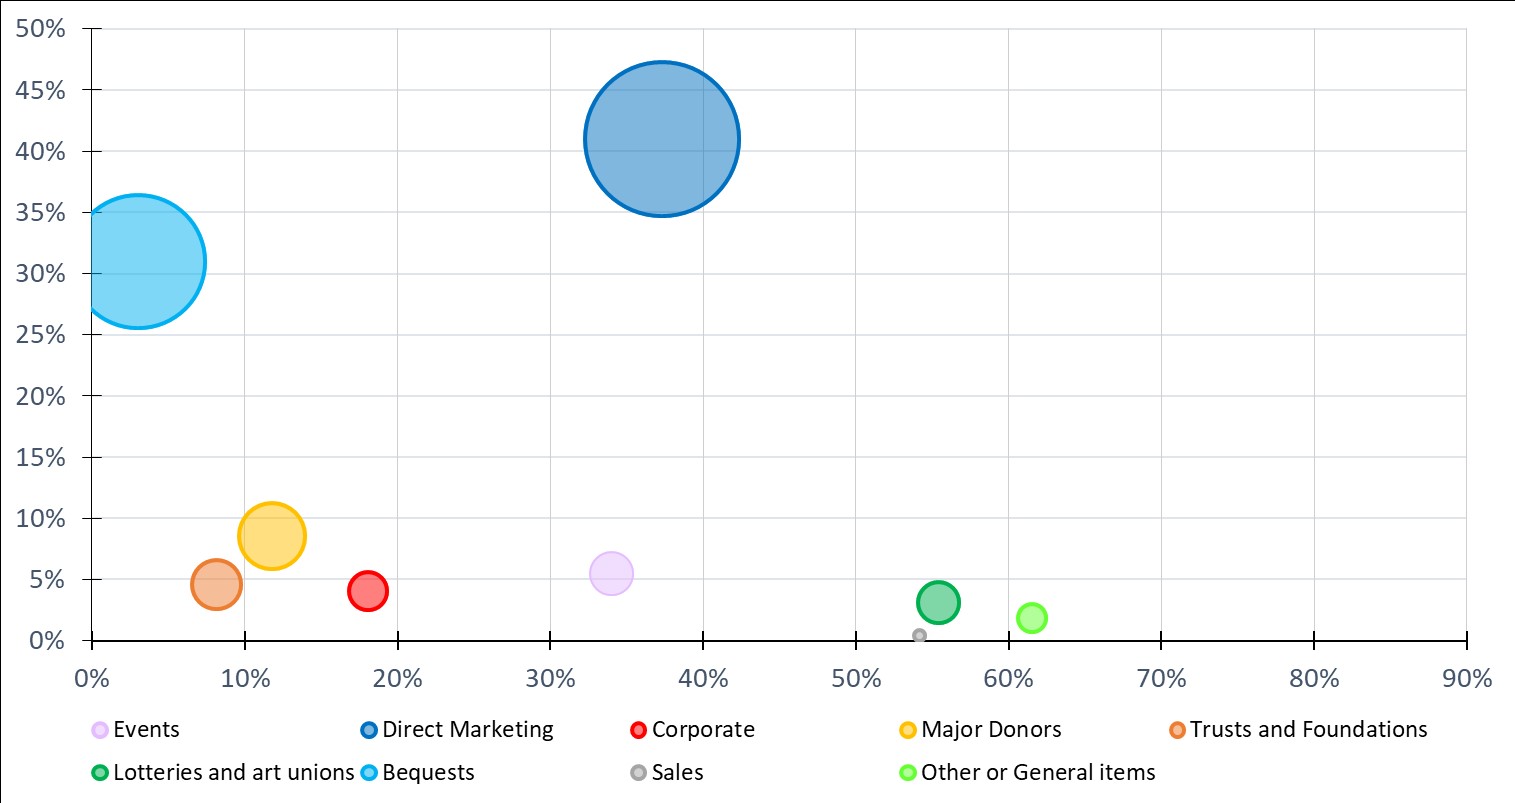
There is of course a spread of reliance and return depending on the organisation but almost no one receives more than 20% of their revenue from Trusts and most have a cost ratio of under 20%.
Behavioural Economics – how much is too much to spend on fundraising?
At More Strategic we are on a mission to get rid of the cost income ratio from our language! In a randomised controlled trial using behavioural economics we discovered that 69% of donors think spending 33% on the costs of fundraising is bad / really bad but if a charity is given $1.00 it is then able to raise $3.00 – 62% of donors thought that was really good.
Fundraising Multipliers – how do Trusts and Foundations perform?
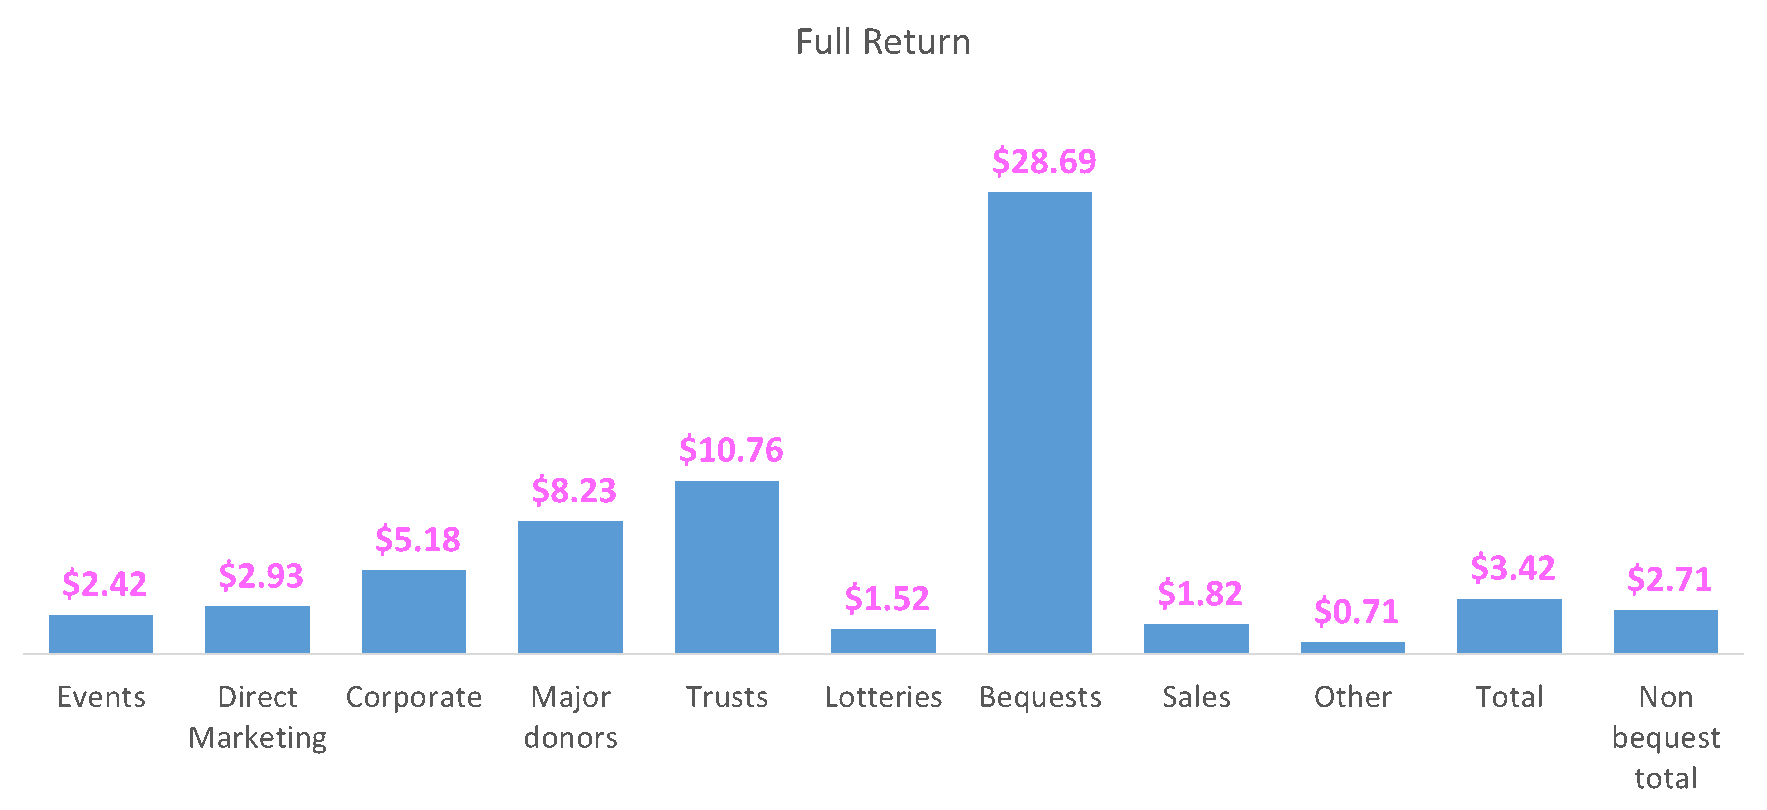
So, let’s take a big picture, long term view of the typical fundraising multipliers for each of the main types of fundraising. This time we are looking at all our data over the past 5 years – 66 organisations and $4billion of income! (of which $145m is from Trusts). We can see that Trusts and Foundations are second only to bequests with a return of $10.76 on every $1.00 invested.
We also know that there are great variations across fundraising programs on how expenditure is allocated between direct costs and salaries. For Trusts fundraising it’s not surprising that the ratio is 86% of expenditure on staff costs – we presume the other 14% must be invested in Strategic Grants!
This also gives us a return on every dollar spent on staff of $12.58 – so check your figures, are you getting a 12-1 return on staff costs? We can also look at the income per Full Time Equivalent (FTE) which works out at roughly $1.1 million, again, how are you doing?
Benchmarking Study results
The charities in our benchmarking study supply 5 years of income, direct costs and salaries so we can also track trends in growth of income and profit for each type of fundraising.
Over the 5 years to 2018, gross income in Trusts fundraising increased by 25% and net by 24%, making it the 5th fastest growing sources of revenue (behind major gifts, corporate and bequests).
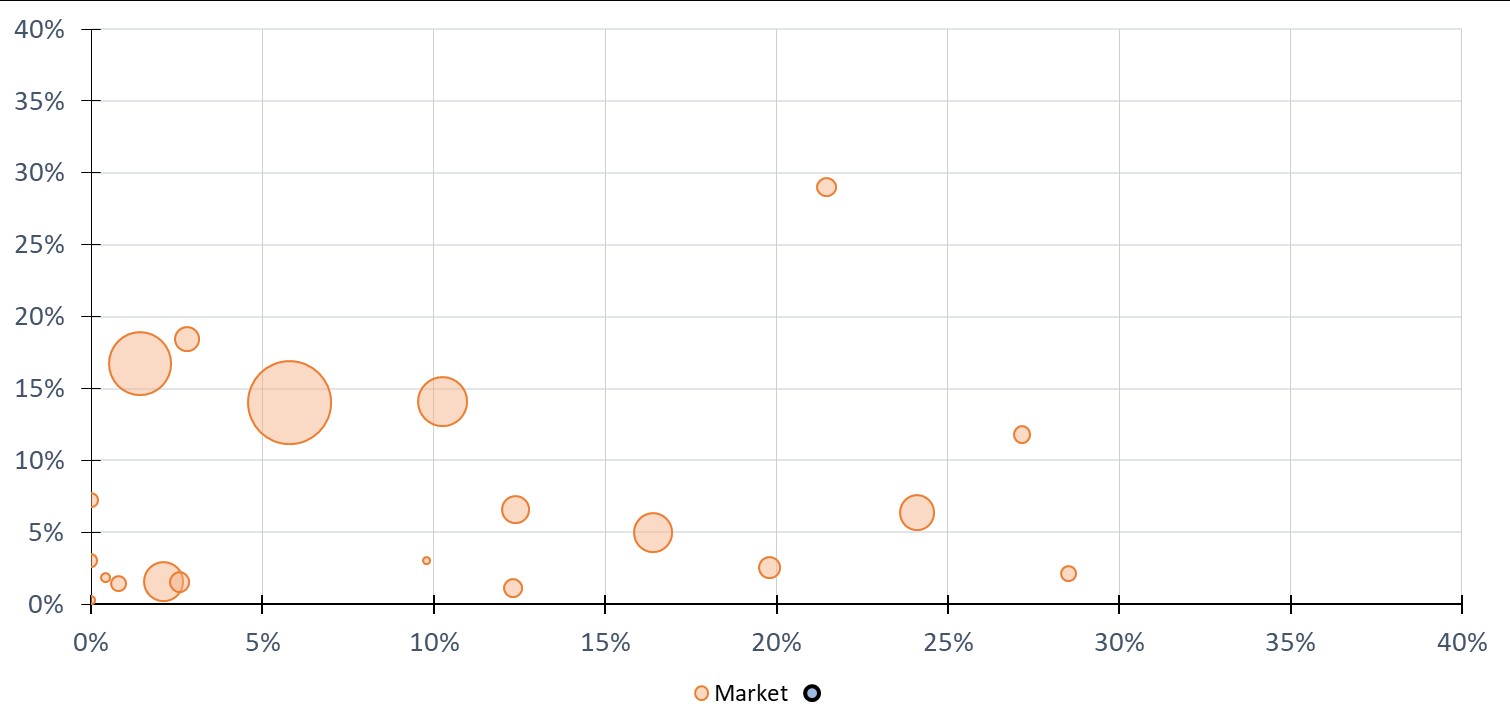
Of course results vary by organisation and this is best illustrated by the “accelerator” chart below which shows the rate of growth of income (vertical) and the rate of growth of all costs (horizontal) for each organisation in the benchmarking study. An organisation that increased costs by 50% over the 5-year period and increased income by 50% would be on the line – those who had income grow faster than costs are accelerating. As we can see for Trusts there are more organisations below the line than above suggesting slower marginal growth.

Trusts and Foundations have one of the very best return rates…this could be a sign that we are actually underinvesting or over performing.
So in closing, if you have grant-ready projects……invest more!